
Los Ebanos, Hidalgo County, Texas
Los Ebanos, Texas | |
|---|---|
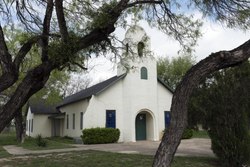 St. Michael the Archangel Catholic Church | |
 Location of Los Ebanos, Texas | |
 | |
| Coordinates: 26°14′37″N 98°33′40″W / 26.24361°N 98.56111°W | |
| Country | |
| State | |
| County | |
| Area | |
| • Total | 0.6 sq mi (1.5 km2) |
| • Land | 0.6 sq mi (1.5 km2) |
| • Water | 0.0 sq mi (0.0 km2) |
| Elevation | 141 ft (43 m) |
| Population (2020) | |
| • Total | 239 |
| • Density | 400/sq mi (160/km2) |
| Time zone | UTC-6 (Central (CST)) |
| • Summer (DST) | UTC-5 (CDT) |
| ZIP code | 78565 |
| Area code | 956 |
| FIPS code | 48-44104[1] |
| GNIS feature ID | 1340592[2] |
Los Ebanos is a census-designated place (CDP) in Hidalgo County, Texas, United States. The population was 239 at the 2020 United States Census. It is part of the McAllen–Edinburg–Mission Metropolitan Statistical Area. The city is named after the Texas Ebony (Ebenopsis ebano) that anchors the Los Ebanos Ferry.[3]
Geography
[edit]Los Ebanos is located at 26°14′37″N 98°33′40″W / 26.24361°N 98.56111°W (26.243665, -98.561039).[4]
According to the United States Census Bureau, the CDP has a total area of 0.6 square miles (1.6 km2), all land. Los Ebanos also serves as an official border crossing between the United States and Mexico via the Los Ebanos-Diaz Ordaz Ferry. The hand-operated cable ferry provides transport between Los Ebanos and Gustavo Díaz Ordaz, Tamaulipas.
Demographics
[edit]| Census | Pop. | Note | %± |
|---|---|---|---|
| 2000 | 403 | — | |
| 2010 | 335 | −16.9% | |
| 2020 | 239 | −28.7% | |
| U.S. Decennial Census[5] 1850–1900[6] 1910[7] 1920[8] 1930[9] 1940[10] 1950[11] 1960[12] 1970[13] 1980[14] 1990[15] 2000[16] 2010[17] 2020[18] | |||
Los Ebanos first appeared as a census designated place in the 2000 U.S. Census.[16]
2020 census
[edit]| Race / Ethnicity (NH = Non-Hispanic) | Pop 2000[19] | Pop 2010[20] | Pop 2020[21] | % 2000 | % 2010 | % 2020 |
|---|---|---|---|---|---|---|
| White alone (NH) | 8 | 6 | 6 | 1.99% | 1.79% | 2.51% |
| Black or African American alone (NH) | 0 | 0 | 0 | 0.00% | 0.00% | 0.00% |
| Native American or Alaska Native alone (NH) | 0 | 0 | 0 | 0.00% | 0.00% | 0.00% |
| Asian alone (NH) | 0 | 0 | 0 | 0.00% | 0.00% | 0.00% |
| Pacific Islander alone (NH) | 0 | 0 | 0 | 0.00% | 0.00% | 0.00% |
| Some Other Race alone (NH) | 0 | 0 | 1 | 0.00% | 0.00% | 0.42% |
| Mixed race or Multiracial (NH) | 0 | 0 | 1 | 0.00% | 0.00% | 0.42% |
| Hispanic or Latino (any race) | 395 | 329 | 231 | 98.01% | 98.21% | 96.65% |
| Total | 403 | 335 | 239 | 100.00% | 100.00% | 100.00% |
As of the census[1] of 2000, there were 403 people, 135 households, and 100 families residing in the CDP. The population density was 711.9 inhabitants per square mile (274.9/km2). There were 168 housing units at an average density of 296.8 per square mile (114.6/km2). The racial makeup of the CDP was 97.02% White, 0.25% African American, 1.99% from other races, and 0.74% from two or more races. Hispanic or Latino of any race were 98.01% of the population.
There were 135 households, out of which 28.9% had children under the age of 18 living with them, 48.9% were married couples living together, 20.7% had a female householder with no husband present, and 25.2% were non-families. 23.7% of all households were made up of individuals, and 13.3% had someone living alone who was 65 years of age or older. The average household size was 2.99 and the average family size was 3.59.
In the CDP, the population was spread out, with 25.6% under the age of 18, 12.9% from 18 to 24, 20.6% from 25 to 44, 20.6% from 45 to 64, and 20.3% who were 65 years of age or older. The median age was 36 years. For every 100 females, there were 73.0 males. For every 100 females age 18 and over, there were 72.4 males.
The median income for a household in the CDP was $7,066, and the median income for a family was $7,692. Males had a median income of $28,750 versus $37,500 for females. The per capita income for the CDP was $6,240. About 64.7% of families and 72.6% of the population were below the poverty line, including 89.7% of those under age 18 and 72.6% of those age 65 or over.
Education
[edit]Los Ebanos is served by the La Joya Independent School District.[22][23] The zoned schools for residents are Sam Fordyce Elementary School,[24] Lorenzo de Zavala Middle School,[25] and La Joya High School.[26]
In addition, South Texas Independent School District operates magnet schools that serve the community.
References
[edit]- ^ a b "U.S. Census website". United States Census Bureau. Retrieved January 31, 2008.
- ^ "US Board on Geographic Names". United States Geological Survey. October 25, 2007. Retrieved January 31, 2008.
- ^ "Texas ebony Ebenopsis ebano". Trees of Texas. Texas Forest Service. Retrieved December 17, 2009.
- ^ "US Gazetteer files: 2010, 2000, and 1990". United States Census Bureau. February 12, 2011. Retrieved April 23, 2011.
- ^ "Decennial Census by Decade". United States Census Bureau.
- ^ "1900 Census of Population - Population of Texas By Counties And Minor Civil Divisions" (PDF). United States Census Bureau.
- ^ "1910 Census of Population - Supplement for Texas" (PDF). United States Census Bureau.
- ^ "1920 Census of Population - Number of Inhabitants - Texas" (PDF). United States Census Bureau.
- ^ "1930 Census of Population - Number of Inhabitants - Texas" (PDF). United States Census Bureau.
- ^ "1940 Census of Population - Number of Inhabitants - Texas" (PDF). United States Census Bureau.
- ^ "1950 Census of Population - Number of Inhabitants - Texas" (PDF). United States Census Bureau.
- ^ "1960 Census of Population - Number of Inhabitants - Texas" (PDF). United States Census Bureau.
- ^ "1970 Census of Population - Number of Inhabitants - Texas" (PDF). United States Census Bureau.
- ^ "1980 Census of Population - Number of Inhabitants - Texas" (PDF). United States Census Bureau.
- ^ "1990 Census of Population - Population and Housing Unit Counts - Texas" (PDF). United States Census Bureau.
- ^ a b "2000 Census of Population - Population and Housing Unit Counts - Texas" (PDF). United States Census Bureau.
- ^ "2010 Census of Population - Population and Housing Unit Counts - Texas" (PDF). United States Census Bureau.
- ^ "Census Bureau profile: Los Ebanos, Texas". United States Census Bureau. May 2023. Retrieved May 17, 2024.
- ^ "P004: Hispanic or Latino, and Not Hispanic or Latino by Race – 2000: DEC Summary File 1 – Los Ebanos CDP (Hidalgo County), Texas". United States Census Bureau.
- ^ "P2: Hispanic or Latino, and Not Hispanic or Latino by Race – 2010: DEC Redistricting Data (PL 94-171) – Los Ebanos CDP (Hidalgo County), Texas". United States Census Bureau.
- ^ "P2: Hispanic or Latino, and Not Hispanic or Latino by Race – 2020: DEC Redistricting Data (PL 94-171) – Los Ebanos CDP (Hidalgo County), Texas". United States Census Bureau.
- ^ "2010 CENSUS - CENSUS BLOCK MAP: Los Ebanos CDP, TX." U.S. Census Bureau. Retrieved on September 17, 2018.
- ^ "SCHOOL DISTRICT REFERENCE MAP (2010 CENSUS): Hidalgo County, TX." U.S. Census Bureau. Retrieved on August 2, 2018.
- ^ "Elementary School Zones 2017-2018 Archived 2018-09-16 at archive.today." La Joya Independent School District. Retrieved on September 16, 2018.
- ^ "Middle School Zones 2017-2018 Archived 2018-09-16 at archive.today." La Joya Independent School District. Retrieved on September 16, 2018.
- ^ "High School Zones 2017-2018 Archived 2018-09-16 at archive.today." La Joya Independent School District. Retrieved on September 16, 2018.
External links
[edit]- LOS EBANOS, TEXAS - Home of the last hand-operated ferry on the Rio Grande
- MoMA - Richard Kleinberg Los Ebanos, Texas 1985
Municipalities and communities of Hidalgo County, Texas, United States | ||
|---|---|---|
| Cities | 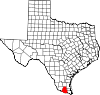 | |
| CDPs |
| |
| Other community | ||